
Download
Research article
Biomechanics of urinary bladder: slow-filling and slow-emptying cystometry and accommodation
Wim A. van Duyl*
Formerly at Department of Medical Physics and Technology, Erasmus University Rotterdam, 5 0 3062 PA Rotterdam, The Netherlands and Department of Electronic Instrumentation, Delft Technical University, 5 2600 AA Delft, The Netherlands
*Corresponding author: Wim A. van Duyl, Email: wavanduyl@cs.com
Competing interests: The authors have declared that no competing interests exist.
Abbreviations used: A1, area of reservoir 1; A2, area of reservoir 2; C, compliance; Cc, cystometrographic compliance; CE, elastic compliance; CE, contractile element; Ch, hydrostatic compliance; Cs, compliance of system: CE and Ch in series; F, flow; h, upper limit of crossbridge lengths; h1, height of fluid level in double-walled reservoir; h’1, height of fluid level in double-walled reservoir above point of measured pressure; h2, height of fluid level in large area reservoir; ∆h, difference in fluid levels; MMs, micromotions; pb, recorded pressure in balloon or bladder; pbt, tonic pressure in bladder; PCE, plasto/contractile element; pd, pressure generated by stress in the wall of balloon or detrusor; PE, plastic element; ∆ph, hydrostatic pressure; R, resistance; SEE, serie elastic element; t, time; T, time constant of mono exponential pressure decay; τ, time constant derived from tonic pressure component; V, bladder volume; VE, elastic volume; Ve, expelled volume; Vet, expelled volume by tonic pressure component; Vew, expelled volume by pressure waves; VP, plastic volume; VR, rest volume; Vr, residual volume.
Received February 18, 2021; Revision received May 19, 2021; Accepted May 23, 2021; Published July 27, 2021
Abstract
OBJECTIVE: In a concept of accommodation of detrusor pressure to volume as an autonomous potency of the bladder, a crucial physiological biomechanical role has been attributed to spontaneous contraction activity. This concept is experimentally investigated on pig bladder in vitro.
METHODS: Slowly emptying of not-stimulated pig bladders via a flow resistor has been recorded and the effect of spontaneous contractions on the tonic pressure during emptying by expulsion has been studied.
RESULTS: The expulsed volume can be separated in a reduction of elastic volume and of rest volume. Tonic pressure is determined by the elastic volume in combination with elastic compliance. In an accommodated state completely transient superimposed pressure waves affect rest volume not elastic volume. Accommodation of tonic detrusor pressure to bladder volume is based on equilibration between passive elongations and active transient contractions distributed in bladder wall.
CONCLUSION: Maintenance of a tonic accommodated detrusor pressure to a constant or slowly varying volume, obtained by a process of equilibration between passive elongations and active contractions, can be understood as an autonomous potency of a bladder. The earlier presented concept of active accommodation has been validated by the experiments. The pressure-volume relation of the bladder is fundamentally revised. Total volume V can be virtually separated in an elastic volume VE and a plastic or rest volume VR. Both parts change with V and in changing ratio. Tonic pressure marks a border between VE and VR.
Keywords: accommodation, compliance, contractions, micromotions, urinary bladder
INTRODUCTION
When a small amount of fluid +ΔV is added to a filled bladder with volume V then we get an increase in detrusor pressure +Δpd. If the addition of ΔV is done fast enough then the pressure increase is followed by a gradual decrease, referred to as pressure relaxation, ending at a slightly higher pressure than before the addition. When a small amount of fluid -ΔV is subtracted fast enough then a pressure decrease -Δpd is followed by a gradual increase, referred to as pressure recovery, ending at a slightly lower pressure than before subtraction. Pressure relaxation is understood as a passive visco-elastic response of the bladder and pressure recovery is understood as an active muscular response of the bladder. Relaxation and recovery are processes which need time to come to an end at a detrusor pressure adapted to the changed volume. In clinical slow-filling cystometry, we intend to fill the bladder at a rate that is low enough for the process of relaxation to adapt tonic pressure to the slowly increasing volume. Such a slow-filling cystometrogram is a recording of adapted detrusor pressure to increasing bladder volume. We expect to get a recording of adapted tonic detrusor pressure also when we apply slow-emptying the bladder at a rate that is low enough for the active process of recovery to adapt tonic detrusor pressure to the slowly decreasing volume. Pressure relaxation and pressure recovery can be understood as antagonistic processes which may correct detrusor pressure after a change of volume. So we expect that the combination of a passive and an active process in the bladder wall promotes adaptation of detrusor pressure to an actual volume, even when it is slowly varying in positive or negative sense. This adaptation is considered as a process of accommodation of detrusor pressure to actual bladder volume.
A concept of accommodation has been presented on the base of equilibrium between distributed passive elongations and distributed spontaneous active contraction or micromotions (MMs) [1]. The process of accommodation can be evaluated by determining the response of detrusor pressure to slow-filling of the bladder but also to slow-emptying. In this paper, we describe an experimentally performed slow-emptying cystometry on pig bladders in vitro, following slow-filling cystometry. In order to explain the experimental results, we recapitulate in this introduction some fundamental biomechanical properties of the bladder. In the concept of accommodation, van Duyl’s model [1,2] is used.
The tonic detrusor pressure is determined by the elastic elongated state of bladder wall. According to the model increasing detrusor pressure, as in slow-filling cystometry, is accompanied by increasing plastic elongation of bladder wall. Plastic elongated state of the bladder is taken equal to rest volume of the bladder. Plastic elongation is caused by stress in bladder wall. Shortening of the plastic elongated state is caused by muscular contraction. Plastic elongation is a particular type of viscous elongation that is limited by a threshold value in stress. Plastic elongated state does not change when load is less than the threshold value. Plastic elongation increases further only when that threshold value is exceeded. The longer the plastic elongated state of bladder tissue, the higher is the threshold to be passed for further plastic elongation [3]. Hence, when pressure in the bladder increases then the elongated state of bladder wall will increase, instantaneously by elasticity and gradually by plasticity. Elastic elongation is limited by the load and restores immediately when load decreases while plastic elongation maintains its attained elongated state when load decreases.
During physiological filling of the bladder and in clinical standard filling cystometry (normally 25–50 ml/min, slow filling < 1 ml/s) to a volume V of approximately 400 ml, the recorded detrusor pressure pd is low e.g., 5–10 cm H2O. The graph of pressure (pd) vs. volume (V) has in the range of 100 to 400 ml an almost linear upwards slope. The ratio of an applied volume change (ΔV) and the caused change of detrusor pressure (Δpd) is defined as compliance C = ΔV/Δpd of the bladder [4]. Ratio ΔV(t)/Δpd(t) depends on the rate of the application of volume change d∆V/dt. Although for the clinical determination of compliance the change of volume (ΔV) need to be small and fast, the magnitude of ΔV and the rate of change ∆V/dt are not standardized by ICS-committee. Bladder compliance is clinically determined to evaluate the storage function of the bladder. In human normal compliance, C is in the range of 20–40 ml/cm H2O.
Compliance which is related only to elasticity of the bladder (CE) and not affected by visco-elasticity or contraction, equals the ratio of a step in volume ∆V(0) to the instantaneously caused change of detrusor pressure ∆pd(0). The upwards slope of a filling cystometrogram yields a cystometrographic value for ∆V/∆pd that is much larger than CE because here ∆V concerns change of total volume while only the increase of the elastic part VE of total volume V is related the increased detrusor pressure. The other part of V is rest volume VR, which is equal to bladder volume when detrusor pressure is zero. Contribution of rest volume to total volume increases the cystometrographically determined compliance that can be in the order of 150–300 ml/cm H2O. It has been proposed to standardize this cystometrographically determined compliance as the ratio of pressure rise associated with an infusion of fixed volume of ∆V = 100 ml [5]. Physiological evacuation of urine is realized by stimulation of contraction of the smooth muscle component in bladder wall. The volume of the bladder after a completed micturition, the residual volume Vr, normally is almost zero. Residual volume corresponds to the minimal rest volume and to minimal rest length of the circumference of the bladder. Because in the model we distinguish the elongated state of the wall of a not-stimulated bladder in an elastic elongated part and a plastic elongated part, we separate total volume V virtually in three separated parts: the elastic volume VE, the plastic volume VP and minimal residual volume Vr, so that V = VE + VP + Vr. The elastic volume VE equals the amount of stepwise withdrawal of the volume out of the bladder that is needed to get simultaneously just zero detrusor pressure. The remaining volume, referred to as rest volume VR, is equal to the sum of plastic volume VP and minimal residual volume Vr: VR = VP + Vr. The actual elastic volume VE is related to the actual detrusor pressure pd. The actual plastic volume VP depends on the attained maximum of previously applied pressure, which is not necessarily the actual pressure. We assume that after completed micturition with residual volume Vr = 0 the plastic elongated state of bladder wall also is zero, so that VR = Vr = VP = 0. A bladder with V = Vr = 0 has the shortest circumference with zero plastic and elastic elongation. Hence for normal bladders, with Vr = 0, the total actual volume V is the sum of an elastic volume VE and a plastic volume VP: V = VE + VP.
Elastic tension of strips of pig bladder can be represented by an elastic element or spring with a certain relation between tension and elongation. The ratio between tension and elongation relative to its rest length is expressed by the elastic parameter E. For pig bladder E has a progressive increasing value with elongation, which means that it is stiffer at more elongated state. When an isometric strip is stimulated to contract then tension increases considerably. According to the classic model of Hill [6] contractility is represented by a contractile element (CE) that is situated in series with the elastic element (SEE). In van Duyl’s model, the contractile element CE and the plastic element (PE) are combined in one plasto/contractile element (PCE). Hence contraction of the CE is identical to shortening of the plastic elongation of PE. For an isometrically fixed strip the change of the length of PCE is compensated by contrary change of SEE.
On the base of known characteristic of SEE the use of the recording of increasing detrusor pressure of an isovolumetric bladder at the start of micturition has been proposed to evaluate the contractility of the bladder, in particular to derive the velocity of shortening of CE [7]. However, this method to determine contractility has soon been replaced by different better methods [8]. The originally proposed method [7] became undermined by surprising experimental results of the determination of the elasticity of stimulated bladder tissue. Spontaneous contraction activity is crucial in the concept of accommodation. Because of this we need to consider the effect of spontaneous contractions on elasticity in the interpretation of the slow-emptying experiments.
After the start of electrical stimulation of an isometrical fixed strip of pig bladder there is an increase of tension across the strip till a maximum. Quick changes of this tension after quick releases and quick stretches yield a figure of elasticity. This elasticity has been measured during the development of contractile state at different levels of tension [9]. The shortening needed to zero tension varied for different strips between 4.5% and 20.5% of rest length, 10% on the mean. Because of this variation it has been concluded that the elasticity of stimulated tissue cannot be described in terms of one discrete SEE, as was supposed in the original contractility measurements [7]. A reduction of circumference of a spherical bladder with 4.5% to 20.5% would mean a reduction of volume V with 13% to 50%, 27% on the mean of total volume V. This reduction of volume to zero pressure, with 27% on the mean of total volume, is equal to the elastic volume VE of a stimulated bladder. According to the model the other part, 87% to 50% of V, would be equal to the rest volume VR of a stimulated bladder.
Even more surprising conclusion drawn from the quick release studies is that quick shortenings needed to zero tension of a stimulated strip is independent of the force level from which release starts and amounts on the mean only 10% of the initial length of the strip. This also implies that this elasticity cannot be accounted for by a discrete SEE. According to the application of the sliding-filaments model of Huxley [10] the elastic elongation of a stimulated strip is determined by the maximum length (h in [9]) in the successive formation of cross bridges within a distribution of lengths. So this maximum length h would be a constant for a certain stimulated strip, though a variable for different strips. From these observations we conclude that the elastic volume VE of a stimulated bladder is almost independent of the level of activated detrusor pressure. It is significant to note that this conclusion is in contrast to the observed elastic volume VE of a not-stimulated bladder which decreases with decreasing passive detrusor pressure.
When during stimulation of an isovolumetric bladder the elastic volume is constant then, this implies that also rest volume is constant despite according to the model the plastic elongated state of PCE is stimulated to contract.
Because the constant part of elasticity of tissue and the variable part elasticity ascribed to the cross bridges are not distinguishable during contraction, we still represent in van Duyl’s model both types of elasticity by just one element SEE and account for the fundamentally changes in elasticity for tissue, when going from passive to active state by the characteristics of SEE.
Contractions, which are spontaneously generated in a not-stimulated bladder, are observed as pressure waves in cystometrograms. Mostly these pressure waves are completely transient, which means that they return to the tonic pressure level, even when this tonic pressure increases in slow-filling cystometry. These waves are considered to be superimposed on the tonic detrusor pressure. Stimulated contractions in case of micturition are supposed to be maintained by stimulation and imply the total muscular component of bladder wall, while spontaneous contractions are transient and imply only parts of bladder wall. The pressure waves are the result of patterns of spontaneous contractions distributed in bladder wall. MMs are a type of spontaneous activity in the wall which may be not observed in variations of detrusor pressure [11].
In present experiments, we studied the properties of the spontaneous activity in relation to the concept of autonomous accommodation [1] of not stimulated pig bladders in vitro by applying slow-filling cystometry of the bladder followed by slow-emptying cystometry by outflow driven by detrusor pressure through a constant flow resistor. For the description of the autonomously driven outflow, we evaluated the elastic compliance, spontaneous activity, elastic volume and rest volume in relation to the concept of accommodation.
EXPERIMENTAL SETUP
Fresh pig bladders were obtained from local slaughterhouse and submerged in a reservoir with a modified Krebs solution aerated by a mixture of 95% O2 and 5% CO2 and kept at temperature of 37°C [12]. The experimental set up for registration of autonomous expulsion by a non-stimulated bladder is shown in Figure 1 [13]. The bladder was kept submerged in the Krebs solution in a double-walled reservoir (cross-sectional area, A1 = 125 cm2). The solution was maintained at 37°C by means of water that surrounded the bath in the double-walled reservoir. A Y-piece was fixed via a rigid tube in the urethra of a pig bladder. Via one leg of the Y-piece, an infusion tube was positioned in the bladder. This catheter was connected to a pressure transducer to measure pressure pb inside the bladder.
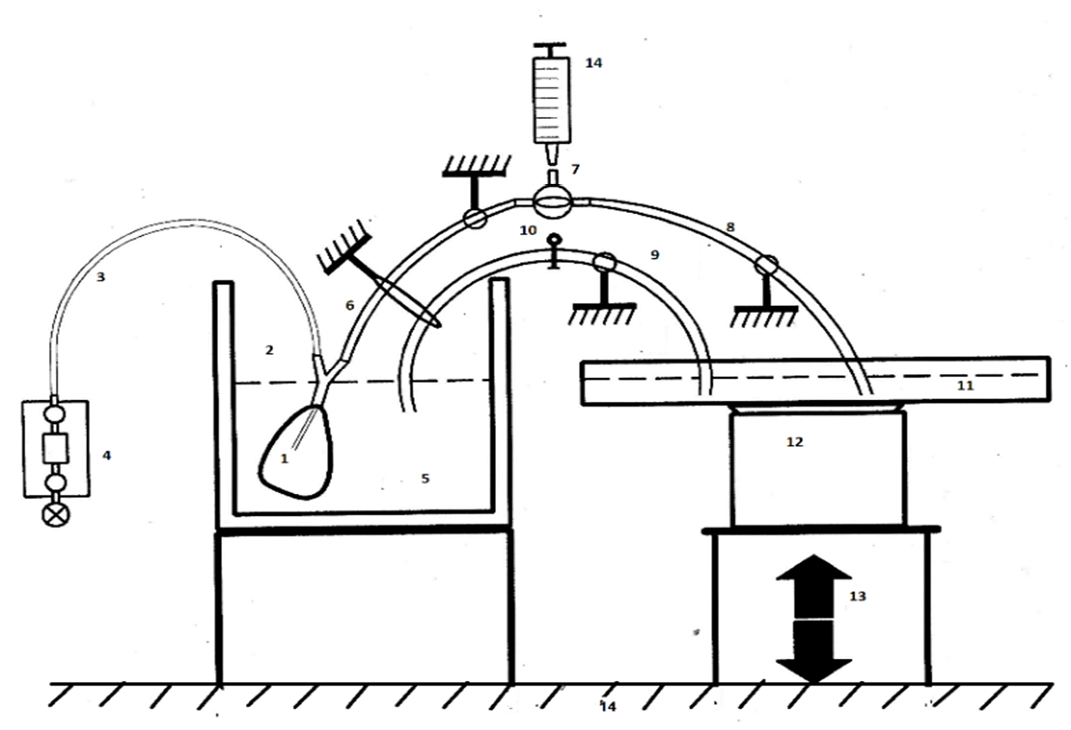

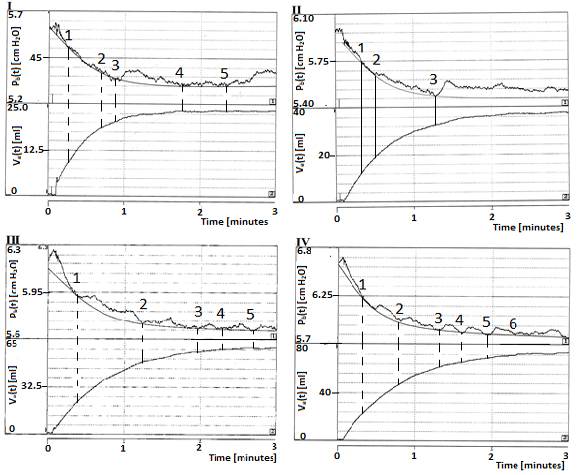
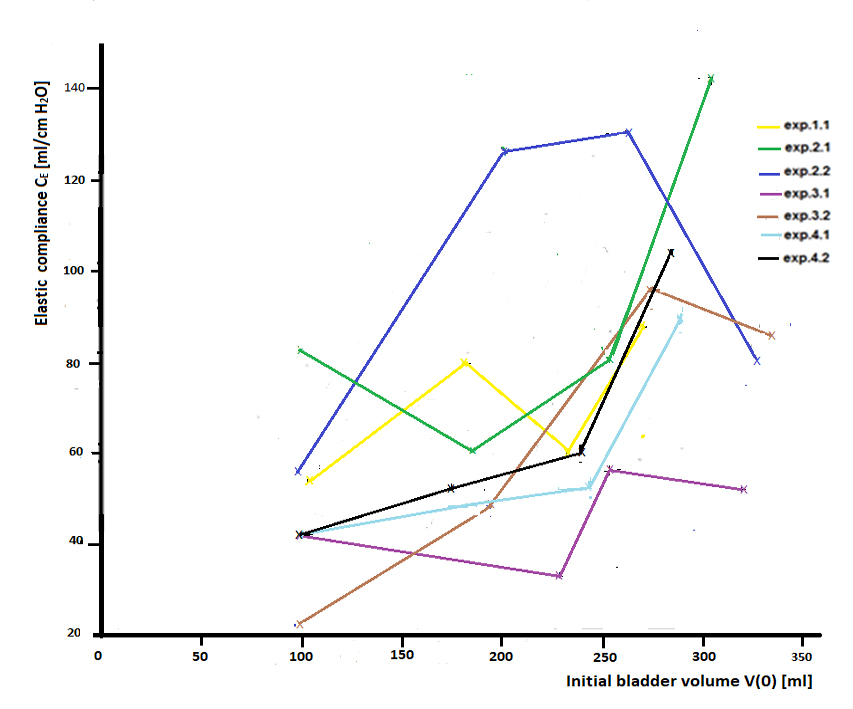
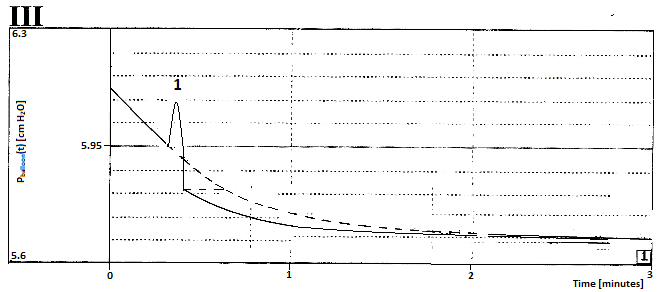
Figure 1. Scheme of the set up used to investigate the expulsions of pig bladders caused solely by non-stimulated detrusor pressure [13]. 1. pig bladder; 2. Y-connector piece; 3. infusion tube; 4. tube to pressure transducer and pressure transducer; 5. double-walled reservoir filled with a modified Krebs solution kept at 37°C and aerated by 95% O2 and 5% CO2; 6. immobilized tubing; 7. three-way cock; 8. immobilized tubing; 9. immobilized siphon tube; 10. pinch; 11. large area reservoir; 12. electronic weighing device; 13. lift device; 14. vibration-free table.
According to the concept of accommodation, even extreme low amplitudes of variations in detrusor pressure and MMs in bladder wall are relevant. Hence, we want to record smaller pressure variations than usually is done in clinical settings. For that reason, the experimental setup was constructed to exclude effects of gravitation and hydrostatic pressure from the weight of fluid in the bladder. Exclusion of this hydrostatic pressure was obtained by applying the principle of communicating vessels in the following way.
A second reservoir, with a large cross-sectional area (A2 = 625 cm2), which was five times wider than the first double-walled reservoir, was connected via a wide siphon tube to the first double-walled reservoir (Fig. 1). The siphon tube could be closed with a clamp. When tube is closed, then the hydrostatic pressure difference across the tube equals the difference in fluid levels in the reservoirs: ∆h = h1 − h2= ∆ph. When tube is opened, it behaves as a siphon between the two reservoirs, such that the fluid levels in both reservoirs become in hydrostatic equilibrium and then h1 = h2. By means of a lift device, the large area reservoir could be adjusted and via siphon the levels in both reservoirs could brought in equilibrium. To exclude motion artifacts, the tubes were fixed and the whole set up was placed on a vibration-free table.
The weight of the fluid in the large area reservoir was recorded by means of an electronic weighing device. A variation of the weight is a measure of the volume of fluid expelled by the bladder and gathered in the large area reservoir. The recorded intravesical pressure pb(t) was measured at a fixed position in the bladder so that the water column above the point of measurement h1 contributes to pb(t) and change in h1 contributes with equal change in ∆pb. Intravesical pressure and expelled bladder volume were measured at a sampling rate of 5/s. The digital signals were recorded simultaneously and stored.
The bladder expelled its contents via separate tubing. A tube was connected to the other leg of Y-piece. At the end of this tube, there was a three-way cock. The second way of this stopcock was connected to a tube that ends in the large area reservoir. The third way of stopcock was used to fill the bladder. Care was taken that no air bubbles were left in the bladder and in the tubing. Resistance (R) to flow (F) via the tract of composed of tube, stopcock and tube was determined in the same experimental setup without a bladder. In the experiments, flow F expelled by the non-stimulated bladder was in the range of 0–3 ml/s and the pressure across R was in the range of 0–2 cm H2O. Within this range, R varied between 0.5–0.7 cm H2O/ml/s.
PROCEDURE OF THE EXPERIMENTS
Prior to the start of each expulsion, the fluid levels in both reservoirs are set in equilibrium via the open siphon tube (Fig. 1) so that the hydrostatic pressure difference between both reservoirs ∆ph(0) = 0. On a bladder, four successive expulsions were recorded (I, II, III and IV). Each expulsion started at a larger initial volume V(0). The experimental procedure for the recording of each expulsion was subdivided into four phases (1, 2, 3 and 4). For one experiment (exp. 4.2), the recording in four phases in the four successive expulsions are shown in Figure 2.
Phase 1: Slow filling
In this phase, the bladder was filled by adding 100 ml metabolic fluid at 37°C via cock and at a low filling rate of approximately 1 ml/s. Filling rate was slow in order to avoid the effects of relaxation. Because siphon is open, the volumes in both reservoirs increase simultaneously and in equilibrium.
Phase 2: Accommodation
To allow for accommodation of the detrusor pressure to the changed volume, in phase 2 approximately 5 min was waited before the start of an expulsion.
Figure 2. Recordings of bladder pressure pb(t) [cm H2O] and volume fluid [ml] in reservoir 11 in a series of four successive expulsion experiments (I, II, III, and IV), each consisting of four phases: infusion (1), accommodation (2), expulsion (3), and equilibration (4). These graphs concern recordings in the the second experiment on pig bladder number 4, exp. 4.2.
Phase 3: Expulsion
At t = 0 in phase 3, siphon was closed with the clamp and via cock tract was opened to enable expulsion. The initial pressure difference across tract caused the start of the expulsion. The expulsion started with initial bladder volume V(0) and intravesical pressure pb(0). Because at that moment ∆ph(0) = 0, the recorded initial intravesical pressure pb(0) is equal to the recorded actual detrusor pressure: ∆pb(0) = ∆pd(0). The expulsed fluid was gathered in the large area reservoir. The increasing weight of the fluid in the large area reservoir was recorded as the expelled volume Ve(t). During expulsion, the liquid level increased in the large area reservoir and decreased in the double-walled reservoir. Hence, during an expulsion, a hydrostatic pressure difference ph(t) between both reservoirs was built up. Pressure difference [pd(t) – ∆ph(t)] was the driver for outflow F(t) via tract. The expelled volume Ve (t) increased during expulsion but stopped when detrusor pressure ∆pd(t) had become equal to the hydrostatic pressure ∆ph(t). During expulsion bladder volume V(t) decreased from V(0) finally to V(final).
Phase 4: Equilibration
Before starting next expulsion, in phase 4 siphon was opened again to re-equilibrate the levels in both reservoirs. During this phase the level increased in the large area reservoir h1 and decreased in the double-walled reservoir h2. A small increase of intravesical pressure ∆pb during the equilibration phase can be observed in the recordings in Figure 2. Following these four phases with each bladder, four successive expulsions were recorded. Each expulsion started from an initial bladder volume V(0) that is equal to the sum of the final volume after previous expulsion V(final) and the slowly added extra volume of 100 ml in phase 1. Because of the allowed accommodation in phase 2 after each addition of 100 ml, the four initial conditions (V(0), ∆pd(0)) before the successive expulsions represent four different adapted states of a slow-filling cystometrogram of the bladder. The experimental procedure was performed seven times on four different pig bladders, twice on each bladder. For one bladder, the procedure was not repeated.
RESULTS
Figure 3 shows more detailed the recordings of four expulsions (phases 3 of the expulsions I, II, III and IV) taken from Figure 2. The recordings of the intravesical pressure pb (t) in all experiments show a wavy decay, accompanied by a continuously increasing expelled volume Ve (t), built up by decreasing outflow F. The expulsions end when detrusor pressure pd (t) equals the hydrodynamic pressure difference ∆ph(t). Hydrodynamic pressure difference ∆ph(t) was built up by the fluid transported from the double-walled reservoir to the large area reservoir.
Figure 3. Detailed results of four successive expulsions (phase 3) I, II, III and IV, taken from Figure 2. The recordings of pb(t) [cm H2O] show that during an expulsion, the expulsed volume Ve(t) [ml] increases, eventually approaching a constant mean value. Smooth lines in pressure recordings are fitted according to a mono-exponential function.
The recordings of the expelled volume Ve(t) reached a plateau Ve(final) at a mean steady intravesical pressure pb(final). In this final state, the expelled fluid Ve(final) is equal to the total reduction of bladder volume Ve(final) = ∆V(final) and the final detrusor pressure pd (final) is equal to the hydrodynamic pressure pd(final) = ∆ph(final). However, in this final state the generation of pressure waves in pb (t) continued. These continuing pressure waves cause a fluctuating flow F in and out of the bladder around mean flow F = 0. Hence the final state is a state of dynamic equilibrium. Fluctuations in F are not seen in variation of Ve(t) because they are damped by the time constant of the fluid collecting system. Detrusor pressure pd(t), generated by the elongated state of bladder wall, primary is the driver of flow F as long as detrusor pressure pd > ∆ph. This holds also for the generated pressure waves. Pressure waves in pb (t) are caused by contractions generated spontaneously anywhere in the bladder wall. These contractions cause extra stress and elongations elsewhere in bladder wall. If the bladder was held isovolumetric and then the contracting tissue would be completely compensated by elongations elsewhere in the wall. If in the experimental situation, we would have maintained experimentally ∆h2 = 0, e.g., by draining the expelled fluid, and then the continuation of the spontaneous generated pressure waves would cause continuation of expulsion and consequently further deceasing volume V, possibly even to zero. However, in the experimental setting a final state of the bladder is attained, with almost constant bladder volume V(final), when pd has become equal to an almost constant pressure ∆ph > 0. It is relevant to note that here this almost constant final state (V(final), ∆pd(final)) is not a consequence of a blocking outflow but of attained equilibrium, which is a fluctuating because of the continued generation of pressure waves.
The measured mean values of the final expelled volume Ve(final) in the expulsions I, II, III and IV in Exp. 4.2 were 23, 37, 57, and 73 ml, respectively. These amounts were expelled within approximately 3 min. After each recorded expulsion, 100 ml was added to the bladder. So, after the successive additions of 100 ml, the initial volumes at each expulsion V(0) successively are: 100 ml, (200 − 23) = 177 ml, (277 − 37) = 240 ml and (340 − 57) = 283 ml, respectively. The expelled volumes during each expulsion, expressed as a percentage of the initial volumes, were 23%, 21%, 24% and 25%, respectively. Table 1 showed the values of Ve(final) and of V(0) of the recorded expulsions during experiments of 4.2, together with similar results obtained in the other experiments.
All the recordings of pressure pb(t) show wavy variations, like in Figure 3. Within the recorded low pressure range, more pressure waves may be observed than in standard cystometrograms. The common view is that the pressure waves are superimposed on a tonic pressure level and that the wavy and the tonic pressure component are independent phenomena. Based on this view, we separated a tonic pressure component from the recordings of pb(t), denoted as pbt(t). For that we selected data points from the pressure recordings of pb(t) which correspond to the lowest ends of the descending limbs of identified pressure waves. In Figure 3, selected data points shown in the graphs have been numbered. A mono-exponential function could be fitted to the selected data points, represented by formula:
(Eqn. 1)
Here parameter τ is the time constant of the fitted mono-exponential decay.
Goodness of fit of a mono-exponential function to the recorded data points depends on number of datapoints available for the fit. The number of selected datapoints is seriously limited by the abundant amount of pressure waves with different duration and small amplitudes. The spread of data points across the fitted mono-exponential function increases with decreasing flow. Nevertheless we have taken the fitted mono-exponential function as representative for the separated tonic pressure component pbt(t). The fitted mono-exponential function has been simulated and for exp.4.2 added to the recordings in Figure 3. The pressure waves are supposed to be superimposed on this separated tonic component pbt(t). The time constants of the tonic components, derived from the recordings I, II, III, and IV in exp. 4.2, are τ = 18, 21, 23 and 31 s, respectively. These time constants are given in Table 1, together with the time constants found in the other experiments.
In equation (1) is ∆pbt(0) the estimated amplitude of the fitted exponential function derived from the fitted exponential function by backwards extrapolation of the function to t = 0. Figure 3 shows that the recorded initial pressure pb (0) is higher than the backwards extrapolated pressure of the fitted mono-exponential tonic pressure component pbt(0). These differences are caused by pressure waves at the start of expulsions.
The amplitudes Δpbt(0) fitted to the recordings of Figure 3, 0.31, 0.42, 0.45 and 0.73 cmH2O, respectively are shown in expulsion I, together with values found in the other experiments. The amplitudes of ∆pbt(0) fitted to the recordings of Figure 3 are respectively: 0.31, 0.42, 0.45 and 0.73 cmH2O are shown in Table 1, together with values found in the other experiments.
The initial conditions of the separated tonic component, (V(0), ∆pb(0)), for the four successive expulsions I, II, III and IV in each experiment are attained via a slow infusion and after a periods of accommodation. We take these four initial conditions as representative for four points of a slow-filling cystometrogram. These four pairs of initial variables (V(0), ∆pb(0)), in exp. 4.2 have a correlation coefficient of 0.9 and can be fitted by a linear regression line ∆pb(t) = 0.002 V + 0.008. The steepness of this part of a slow filling cystometrogram, drawn through the four points of (V(0), ∆pb(0)), yields for the cystometrographically determined compliance Cc the high value 1/0.002 = 500 ml/cm H2O. In a similar way we find in the other experiments, on the base of the four points (V(0), ∆pb(0)) during filling, a linear increase of initial tonic bladder pressure with initial values of bladder volume. However, for the analysis of the expulsion the elastic compliance CE in combination with the elastic volume VE is more interesting than the cystometrographically determined compliance Cc.
A part Vet(t) of totally expelled volume Ve that is expelled only by the tonic component from the part Vew (t) that is expelled only by the pressure waves. To relate the expelled volume Vet (t) to the fitted tonic component of intravesical pressure pbt(t) of equation (1) in the experimental setup, we introduce a system compliance parameter Cs so that:
Vet(final) = Cs(pbt(0) – pbt(final))
(Eqn. 2)
The values of Cs can be derived from the time constants, τ = RCs, of the exponential function in equation (1). For the flow resistance R, we have taken a constant value that may correspond to the mean value for the variable low flow during expulsion: R = 0.6 cm H2O/ml/s. Then from the fitted time constants τ in I, II, III and IV of exp. 4.2, we find: Cs = 36, 42, 46 and 62 ml/cm H2O.
By substitution in (2) for pbt(t) = pbt(final), we get the finally expelled volume only by the tonic component Vet(t) = Vet(final). We find for Vet(final) from the recordings I, II, III, and IV in exp. 4.2 is 11, 18, 21 and 45 ml, respectively. These values of Vet(final), expressed as percentages of finally expelled total volume Ve(final), are 48%, 49%, 37% and 62%, respectively. Obviously a large part of the recorded expelled total volume Ve(final) cannot be ascribed to expulsion by the separated tonic pressure component pbt(t) but need to be ascribed to the part Vew(final) that is expelled by the superimposed wavy or fluctuating pressure component pbw(t). According to the model, the expelled volume Vew(final) equals reduction of rest volume VR. In Table 1, values for Vet (final) and the derived values of Vet(final)/Vew(final) derived from the recorded expulsions in all experiments are shown.
So far we based the calculations of Cs and Vet (final) on the recordings of intravesical pressure pb(t), but we want to derive CE from a recording of pd(t). For this derivation the experimental set up has a complication. The tonic component pbt is not the elastic driver of outflow F, but tonic detrusor pressure component pdt is the driver. In the experimental setup, flow rate F is reduced by the hydrodynamic pressure ∆ph that is built up by the expelled fluid. The consequence is that the calculated value of Cs is larger than the elastic compliance CE of the bladder.
In the supplementary information, the course of pdt(t) and of pbt(t) has been derived for the system where the bladder is replaced by a fully elastic balloon with a total volume V equal to the sum of a variable elastic volume VE with a constant elastic compliance CE and a constant rest volume VR. It has been shown in the supplementary information that for such a balloon the intra-balloon pressure pbt(t) decays according to a mono-exponential function like equation (1) with a time constant T = RCs and that CE can be derived from Cs according to:
CE = ChCs/(Ch − Cs)
(Eqn. 3)
with Ch = A1A2 /(A1 + A2) = 104 [ml/cm H2O].
Because we assume that the separated tonic component of detrusor pressure is caused by the elasticity of the wall of the bladder, we can use the balloon as a model for the interpretation of the recordings of the tonic pressure component of the bladder and take τ = T. Because pbt (final) > 0, the amplitude of the fitted mono-exponential function Δpbt(0) is smaller than the initial tonic detrusor pressure pdt(0). According to (19A) the initial amplitude of the pressure in the balloon caused by stress in the wall denoted by pd (0) and which we assume to be equal to the initial tonic pressure pdt(0), can be derived from:
pdt(0) = pbt(0) + ∆ph(final) = pbt(0) + Ve(final)/Ch
(Eqn. 4)
With the values of time constant τ and the values of Cs derived from the recordings of expulsions I, II, III, and IV in exp. 4.2, we find 42, 53, 60 and 104 ml/cm H2O, respectively by applying equation (3) for the elastic compliance CE of the bladder. These values of the elastic compliance and the values for CE derived from the recordings of all the experiments are given in Table 1 and represented in Figure 4. On general these elastic compliances are larger than the reported values of compliance of human bladder.
Figure 4. Dependance of elastic compliance CE [ml/cm H2O] on initial bladder volume V(0) [ml], derived from the exponential decay of the separated tonic detrusor pressure components in all the experiments during not-activated expulsions.
Table 1. Results of analysis: Ve(fin) expelled final volume [ml]; V(0) initial bladder volume [ml]; tau = τ time constant of fitted mono-exponential decay [s]; Δpbt(0) amplitude of fitted mon-exponential decay [cm H2O]; Vet(fin) finally expelled volume [ml] by the tonic component/Vew(fin) finally expelled volume [ml] by the wavy component; CE elastic compliance [ml/cm H2O]; VE(0) initial elastic volume [ml]/VR(0) initial rest volume [ml]; VE(0) as a percentage of V(0).
| exp | Ve(fin) | V(0) | Τ | Δpbt(0) | Vet(fin)/Vew(fin) | CE | VE(0)/VR(0) | VE(0)% |
|---|---|---|---|---|---|---|---|---|
| 1.1-I | 20 | 100 | 21 | 0.30 | 11/9 = 1.2 | 53 | 26/74 = 0.35 | 26 |
| -II | 47 | 180 | 27 | 0.58 | 26/21 = 1.2 | 80 | 82/98 = 0.84 | 45 |
| -III | 65 | 233 | 23 | 0.80 | 30/35 = 0.9 | 60 | 86/147 = 0.59 | 37 |
| -IV | 80 | 268 | 29 | 0.97 | 47/33 = 1.4 | 89 | 155/113 = 1.37 | 58 |
| 2.1-I | 17 | 100 | 28 | 0.17 | 8/9 = 0.9 | 86 | 28/72 = 0.39 | 28 |
| -II | 32 | 183 | 23 | 0.24 | 15/17 = 0.9 | 61 | 34/149 = 0.23 | 19 |
| -III | 44 | 251 | 27 | 0.37 | 17/27 = 0.6 | 80 | 63/188 = 0.34 | 25 |
| -IV | 44 | 307 | 36 | 0.40 | 24/20 = 1.2 | 141 | 116/191 = 0.61 | 38 |
| 2.2-I | 10 | 100 | 22 | 0.17 | 6/4 = 1.5 | 57 | 15/85 = 0.18 | 15 |
| -II | 23 | 190 | 34 | 0.23 | 13/10 = 1.3 | 126 | 56/134 = 0.41 | 29 |
| -III | 35 | 267 | 35 | 0.37 | 21/14 = 1.5 | 131 | 93/174 = 0.53 | 35 |
| -IV | 52 | 332 | 27 | 0.51 | 23/29 = 0.8 | 80 | 81/251 = 032 | 24 |
| 3.1-I | 18 | 100 | 18 | 0.40 | 11/7 = 1.6 | 42 | 24/76 = 0.32 | 24 |
| -II | 29 | 182 | 15 | 0.49 | 12/17 = 0.7 | 33 | 25/157 = 0.16 | 14 |
| -III | 32 | 253 | 22 | 0.49 | 18/14 = 1.3 | 57 | 46/207 = 0.22 | 18 |
| -IV | 35 | 321 | 21 | 0.52 | 18/17 = 1.1 | 53 | 46/275 = 0.17 | 14 |
| 3.2-I | 10 | 100 | 11 | 0.20 | 4.0/6.0 = 0.7 | 22 | 6/94 = 0.06 | 6 |
| -II | 22 | 190 | 20 | 0.23 | 8/14 = 0.6 | 48 | 21/169 = 0.12 | 11 |
| -III | 31 | 268 | 30 | 0.36 | 18/13 = 1.4 | 96 | 63/169 = 0.37 | 24 |
| -IV | 43 | 337 | 28 | 0.45 | 21/22 = 1.0 | 86 | 74/263 = 0.28 | 22 |
| 4.1-I | 21 | 100 | 18 | 0.49 | 17/4 = 4.3 | 42 | 29/71 = 0.41 | 29 |
| -II | 40 | 179 | 20 | 0.48 | 18/22 = 0.8 | 48 | 41/138 = 0.30 | 23 |
| -III | 49 | 239 | 21 | 0.62 | 19/30 = 0.6 | 53 | 57/182 = 0.31 | 24 |
| -IV | 57 | 290 | 29 | 0.57 | 27/30 = 0.9 | 89 | 99/191 = 0.52 | 34 |
| 4.2-I | 23 | 100 | 18 | 0.31 | 11/12 = 0.9 | 42 | 22/78 = 0.28 | 22 |
| -II | 37 | 177 | 21 | 0.42 | 18/19 = 0.9 | 53 | 41/136 = 0.30 | 23 |
| -III | 57 | 240 | 23 | 0.45 | 21/36 = 0.6 | 60 | 60/180 = 0.33 | 25 |
| -IV | 73 | 283 | 31 | 0.73 | 45/28 = 1.6 | 104 | 148/135 = 1.1 | 52 |
Although during an expulsion of a particular bladder the derived value for CE almost is a constant within the range of small expelled volume compared to total volume V(0), the value of CE in separate expulsions at different initial bladder volume V(0) shown in Figure 4 appears to vary considerably. Nevertheless we may conclude that the large variations in CE show an increasing trend with increasing initial bladder volume V(0) with roughly a factor 2. The increasing trend of CE with increasing volume, in combination with the property of plasticity, explains that in normal slow-filling cystometrograms pressure increase with increasing volume is low. Before discussing the large variation in CE we need to consider sources of error in the results. There are two main sources of error which may contribute to the found variation in CE. One source concerns the spontaneous nature of contraction activity which limits the number of points available to fit the mono-exponential function of equation (1). By judgement of the fitted exponential function the error of the fitted time constant τ is less than 10%. The second source of error is connected to the choice of a constant resistance R = 0.6 cmH2O/ml/s, while results of separate measurements described in a previous section indicate that R may decay with approximately 10% during exponentially decaying flow. Substitution of a constant value of R in the fitted time constant τ yields a constant value of Cs. A decay of R during expulsion however would imply an actual value of Cs that increases with approximately 10%. Hence, the actual value CE may vary a little bit during an expulsion instead of being constant. This effect would affect CE repeatedly in every expulsion in a similar way. Such an effect is not seen in Figure 4. We conclude that the large variation in CE shown in Figure 4 cannot be ascribed to experimental errors and need to be taken as a property of bladder elasticity. In Figure 4 we see no differences in biological variation between the graphs of CE of different bladders and physiological variations in graphs of repeated measurements on the same bladder. The large variation in CE is consistent with the large biological and physiological spread in elasticity parameters reported for pig bladder strips [3]. In the discussion section, we consider the elastic compliance of passive bladder tissue in connection to the elastic compliance of activated bladder.
As VE(0) = ∆pdt CE, we can calculate the elastic parts ∆VE(0) of total volume V(0) at the start of each expulsion by using (4) to find pdt. The other initial part of V(0) is the rest volume VR(0) which is equal to plastic volume ∆VP(0). For the expulsions I, II, III, and IV in exp. 4.2, we find for the initial elastic volume VE (0) respectively: ∆VE(0) = 22, 41, 60 and 148 ml or 22%, 23%, 25% and 52% V(0). The found increasing initial percentage of the amount of elastic volume is small. The elastic volume VE(0) increases with V(0). By subtraction of VE(0) from V(0), we find for rest volume in exp. 4.2: VR(0) = 78, 136, 180 and 135 ml. Rest volume VR(0) also increases with V(0). Both VE(0) and VR(0) represent accommodated conditions with volume V(0). The larger initial elastic volume VE(0) is accompanied by larger initial detrusor pressure Δpd(0), proportional to parameter CE. However, because we found that CE show an increasing trend with increasing volume V(0) (Fig. 4), we expect that the elastic volume will increase steeper and more than linearly with increasing Δpd(0). An increasing trend in CE with volume V(0) would imply that, in case of a linear cystometrogram, the elastic volume would increase steeper and more than linearly with increasing V and increasing pd. In other words, in the linear part of the cystometrogram both VE and VR will increase, but the ratio of VE/VR would not be constant but would increase with V. For exp.4.2-I, II, III and IV, we find for this ratio VE(0)/VR (0) is 0.28, 0.30, 0.33 and 1.1, respectively. VE(0)/VR(0) have a large variation but show indeed an increasing trend with V(0). These values are shown in Table 1, together with those values derived in all the other experiments.
We found a relation between spontaneous pressure waves and changing rest volume as part of total bladder volume. This is an important point of difference between the biomechanics of the bladder and the elastic balloon with constant rest volume, referred to in the supplementary information as a model for the bladder. We need to pay attention also to another remarkable difference. That the spontaneous pressure waves are superimposed on tonic pressure is well known, however this fact is a remarkable phenomenon. In Figure 5, the fitted mono-exponentially decaying tonic pressure component of expulsion III of Figure 3 has been reproduced. This time, however, we consider this decaying component as if it concerns the decay of the pressure in the elastic balloon. During this decay, we simulate at point 1 in Figure 5 the start of a pressure wave caused by contracting of a small region of the wall of the elastic balloon during a small period. During this period of increased pressure in the balloon, the amount of expelled fluid is larger than would be expelled without that pressure wave. Hence after this pressure wave the expulsion of the balloon will continue from a lower volume and from a lower pressure, driven by the balloon with still unchanged elastic compliance. The effect of the interruption of the course of the mono-exponential decay of pressure in the balloon by the simulated pressure wave is illustrated in Figure 5. Such a simulated pressure wave causes an extra reduction of the elastic volume of the balloon.
We have seen that a spontaneous pressure wave of the bladder, superimposed on the tonic pressure, also causes extra expulsed volume. Superposition of a spontaneous pressure wave on tonic pressure means however that the pressure wave ends at the tonic level that is equal to the extrapolation of the mono-exponential decay that is not affected by the pressure wave. This means that in contrast to the elastic balloon, the extra volume Vew(t), expelled by the contraction wave, is not expelled at expense of the elastic volume VE (t) of the bladder. In other words, the extra expelled volume Vew(t) implies reduction of another part of bladder volume V. That other part is rest volume VR. This conclusion is explained by van Duyl’s model as follows.
Figure 5. Simulated effect of a pulse wise contraction of a region of an elastic balloon on the course of pressure decay pballoon(t) during expulsion via a constant flow resistor with the elastic volume of expulsion III of Figure 3.
A pressure wave of the bladder is caused by contraction of the muscular component of the bladder wall. So the extra expelled volume Vew (t), which is not supplied by the elastic volume, is supplied by reduction of the part of bladder volume that is determined by the contractile tissue. A pressure wave that ends at the tonic pressure level is called completely transient. According to van Duyl’s model recovery of a contracted state of contractile tissue is obtained by plastic elongation of that contractile tissue. The expelled volume after a completely transient pressure wave implies that at the end of contraction wave the contracted state is not completely recovered and that a reduced plastic elongated state remains. The plastic elongated state of bladder wall determines its rest volume VR. So the expelled volume Vew(t) equals a net reduction of rest volume after each pressure wave. We conclude that during an expulsion experiment the elastic volume of the bladder decreases gradually caused by tonic pressure and the rest volume of the bladder decreases piecewise caused by each spontaneous contraction wave. From the experimental data, we can derive these two principally different decaying parts of the expelled total volume Ve(t).
During a pressure wave, rest volume varies but ends with a certain net reduction of rest volume. A data point, selected at the end of a pressure wave and coincides with the tonic pressure, means that variation of rest volume has stopped because then pressure equals tonic pressure. If after such a data point no more pressure waves would follow then VR (= VP) would not change any more and detrusor pressure would follow the course of the tonic pressure. Detrusor pressure pd is said to be accommodated to a certain bladder volume V if for constant volume detrusor pressure is constant. As explained earlier this accommodated condition is fulfilled at the end of each accommodation phase 2 in the experiments. Now we specify the accommodated condition of the bladder more detailed by saying that in this condition both elastic volume VE and rest volume VR are constant.
The accommodation processes end at the data points where contraction waves coincide again with tonic pressure. Between point of beginning and point of ending of a completely transient contraction wave is a process of accommodation. In other words these points, which we have selected to separate the tonic pressure component, can be considered as points of accommodation. The observation of points of accommodation in this study indicates that emptying of the bladder during the expulsion is slow enough to be followed by the accommodation process.
Piecewise reductions of elastic volume and of rest volume between data points numbered in Figure 3 can be derived as follows. With known time constant τ = T = RCs we calculate the volume Vet(t) that has been expelled at the data points only by the exponentially decaying pressure component. The total amount of expelled volume Ve(t) at that point can be read from the recording of expelled volume. In Figure 3, the selected data points of pbt(t) are connected with the corresponding points of the recording of expelled volume Ve(t). When we subtract the calculated reductions in ∆Vet(t), which equals the successive reduction of VE from the recorded Ve(t) at these points then we get Vew(t), which equals the successive reduction of the rest volume VR. In Table 2, the values of Vet(t)/Vew(t) at the points of accommodation marked in Figure 3 are shown.
The reductions in VE progress by following the mono-exponential function, while the piecewise reductions in VR depend on the varying amount of preceding spontaneous contraction activity. Despite the varying amounts of piecewise reductions in rest volume, after each reduction the accommodation process has ended in a point of an accommodated state.
We conclude that the course of tonic pressure marks the virtual border between changing elastic volume related to tonic pressure and changing rest volume with zero pressure. Needless to say that this type of accommodation of the bladder, which depends on contraction activity, is not possible with a passive elastic balloon.
DISCUSSION
In this experimental study, it has been shown that any contraction activity affects the rest volume of the bladder, which concerns a large part of total volume, besides the elastic volume as the other part that determines tonic detrusor pressure. To reach states of accommodation, it is necessary that pressure waves generated by the contractions are completely transient so that the waves return to the tonic level. However, we still need to look for an explanation for that return of pressure waves to the tonic level not affected by the wave. Spontaneous pressure waves are generated by regional contractions distributed in bladder wall, with varying area and amplitude and may migrate in the wall [1]. The course of a pressure wave may be complex. Variation of detrusor pressure, associated with varying rest volume, is determined by the combination of distributed development and recovery of the active contraction of muscle cells in certain regions of bladder wall, followed by distributed passive elongation caused by stress in the wall. According to van Duyl’s model, restauration of a contracted state is obtained by plastic elongation. At the end of a completely transient pressure wave, the recovered elongation of the previously contracted state of muscular tissue is such, that the original elastic elongated state of total bladder, determined by the elastic volume VE, is restored. The decaying flank of the pressure wave ending at the tonic level is caused by passive pressure relaxation. When total bladder volume is constant, with a constant tonic pressure so that also the elastic volume is constant, then it is evident that at the end of a completely transient pressure wave net variation of rest volume caused by that pressure wave is fully restored to zero. Hence, at the end of a completely transient pressure wave, plastic recovery of a region from a contracted state is such that in case of constant bladder volume rest volume and elastic volume have not changed.
Table 2. The values of Vet(t)/Vew(t) at the points of accommodation marked in Figure 3.
| Expulsion | Vet(t)/Vew(t) at the points of accommodation (ml) | |||||
|---|---|---|---|---|---|---|
| I | 1: 3.6/5.9 | 2: 7.6/9.4 | 3: 9.4/10.6 | 4: 10.8/12.2 | 5: 11.2/12 | |
| II | 1: 6.0/6.0 | 2: 11/7.0 | 3: 17/15 | |||
| III | 1: 12/10 | 2: 18/32 | 3: 19/40 | 4: 21/38 | 5: 21/39 | |
| IV | 1: 23/0.0 | 2: 40/6.0 | 3: 46/27 | 4: 48/19 | 5: 49/21 | 6: 49/23 |
During a regional contraction, the remaining passive bladder wall maintains its plastic elongated state as long as the threshold for more plastic elongation is not surpassed by stress. For a small contracting region, the elastic stress generated by the remaining passive wall is dominant in the passive process of recovery of the size of that a region, with regard to both its elastic elongated state and its plastic elongated state. The recovered elastic elongated state is maintained by stress. The recovery of the plastic elongated state is obtained by the actual stress but is limited by the threshold and then is maintained without stress. The dominance of the passive wall in determining stress explains the full re-establishment of detrusor pressure to tonic pressure, combined with fully recovered rest volume, after a completely transient pressure wave. This dominance in stress is the condition to attain the accommodated state.
In contrast to a bladder with constant volume, net change of rest volume at the end a completely transient pressure in the expulsion experiments is not zero. Then the final pressure of the wave equals to a tonic pressure that is lower than at the beginning of the pressure wave. This means a not full recovery of a region from a contracted state by plastic elongation. The not restored plastic part of the wall during a pressure wave determines here the extra volume expelled by the pressure wave Vew(t). In the expulsion experiments, accommodated states are attained after small adapting reductions of rest volume VR, provided that stress in bladder wall is dominated by the passive properties of not active regions of the wall. Sometimes a pressure wave is generated that is not followed by restored rest volume, e.g., seen in expulsion I and II of Figure 3. Such a spontaneous pressure increase may end at an accommodated state at a higher detrusor pressure.
The observed points of accommodated states after completely transient pressure waves during the autonomous expulsion experiments demonstrate that the pressure decay is slow enough to be followed by the active process of accommodation. The observed points of accommodation during this slow-emptying cystometry are similar to the accommodated points observed during slow-filling cystometry.
Because of the complex nature of the combination of distributed contraction activity and distributed recovery the pressure waves are not always pulsatile but may have an extended fluctuating contour as seen in Figure 3. For instance, recording II of Figure 3 we notice between accommodation 2 and 3 a pressure wave having a plateau with a small amplitude with a duration of approximately one minute. This wave might be generated by a small contraction that propagates in the wall, as has been simulated in [1]. In practical situations, a pressure wave may be considered as completely transient, while the end of that pressure wave is not be well detected because unobserved small pressure variations like MMs may continue the process of accommodation at a small scale. Continuation of this implies that even the tonic detrusor pressure is the resultant of a dynamic state of equilibrium. Values of the threshold for plasticity, associated with “holding of slippage of the filaments” [14], probably are less fixed than so far is suggested and may be fluctuating. These fluctuations may cause fluctuations in plastic elongated state which in an accommodated state is corrected by MMs.
According to the concept of accommodation detrusor pressure is said to be accommodated to bladder volume if the ratio VE/VR is almost constant. The accommodation process implies adapting variation of the ratio VE/VR. Stability of the accommodated state depends on the dominance in generation of stress by the passive state of the bladder wall that needs to be sufficient to restore contracted regions to the original elongated size. For an effective accommodation process, the spontaneous pressure waves need to be completely transient and to be limited to small parts of bladder wall. To attain states of accommodation, variation of bladder volume needs to be slow enough to be followed by the restauration process of bladder regions by the combination of contractions and elongations. Because the spontaneous contractions are regional and distributed, plastic elongated state and values of the threshold are also distributed and are determined by the history of contraction activity of the bladder. Hence, because of varying contributions of rest volume in slow-emptying and slow-filling experiments, a certain detrusor pressure can be accommodated to different bladder volumes of a bladder with a certain elastic compliance.
When by any external cause tonic detrusor pressure decreases, then the recovery of regions from localized spontaneous contractions ends with decreased rest volume, so that elastic volume has increased and the original decrease of tonic pressure is partly reduced. When, on the other hand, by any external cause tonic detrusor pressure increases, then the recovery of regions from localized spontaneous contractions will end with increased rest volume, so that elastic volume has decreased and the original increase of tonic pressure is partly reduced. In this way, spontaneous activity has correcting effects on externally caused changes of tonic pressure by adaptation of ratio VE/VR. So the accommodation process maintains tonic detrusor pressure at an equilibrium within in a certain marge, in spite of disturbance from its environment. Activation of contractile tissue is accompanied by considerable increase of stiffness [9], hence by decrease of CE. Variable stiffness caused by variable contraction activity might contribute to the found variation of CE in Figure 4. However, this assumption would be in contradiction with our conclusion that for accommodation the contraction activity needs to be limited to small regions of bladder wall. We claim that the effect of the limited spontaneous activity on compliance CE is negligible in case of accommodation. We found in the experiments on not-stimulated accommodated pig bladder that the elastic volume VE(0) varies in the range of 6% to 58% of total V(0). This range of the elastic volume VE(0) is almost equal to the range of elastic volume, estimated to be in the range of 13% to 50% of total volume V, of an isovolumetric stimulated bladder.
From the quick release studies, it has been concluded that a large part of series elasticity might not reside in the cross bridges but in series with a number of cross bridges [9]. Similarity in range of variation suggests that the variation of elasticity for passive and for active bladder have the same source in tissue. Then the variation in elasticity, represented by varying SEE or CE, found in present study for the not activated bladder, is similar to the variation found for an activated bladder. In other words, physiological spread in these elasticity parameters depends on the variable activated state of contractile tissue but would depend also on the variable passive state of contractile tissue. This suggestion is supported by the remarkable other phenomenon of activated bladder strips referred to in the introduction section.
We referred to the observed phenomenon that during activation of an isovolumetric bladder the elastic volume would not change [9]. Then during transition of the total wall of an isovolumetric bladder from passive to full contractile state the elastic volume and by consequence also rest volume would not change and pressure increase during activation is primarily caused by the increase of stiffness of the elasticity of the wall that is expressed in a decrease of CE. This variation of elasticity concerns active contractile tissue. During transition of the state of whole bladder wall from passive to activated under isovolumetric condition, both the elastic volume and rest volume would not change so that the passive accommodated condition with regard to VE(0) and VR(0) is the start condition of activation and is maintained during process of activation. This assumption is consistent with the observation that variation in VE(0) is in the same range for passive and activated bladder. In this way variation of CE for passive and for activated bladder are connected to each other. We express this conclusion in the hypotheses to be tested in a separate study that total stimulation of a bladder under isovolumetric condition mainly affects stiffness of the elasticity of bladder wall and causes neither net contraction nor net plastic elongation or net elastic elongation in bladder wall. This transition of bladder tissue from passive to activated state justifies the use of one mechanical model to describe the varying state of the bladder from fully passive to fully activated.
Active small regions may contract because of the high elastic compliance of the remaining passive wall. Increasing area of spontaneous contraction activity may be accompanied by transition from physiological effective accommodation to destabilization of detrusor pressure, eventually causing clinical complaints. It would be useful to be able to evaluate the distributed character of spontaneous activity by means of a clinical feasible technique that enables the expression of the amount of distributed contraction activity in a parameter on a bladder performance scale [1,2].
Cyclic functioning of urinary bladder encloses a collection phase and an evacuation phase. The collection phase is clinically evaluated by recording detrusor pressure during continuous slow filling of the bladder. We have considered biomechanical behavior of the bladder in case of slow emptying. Because of the effect of hysteresis with plastic deformation, rest volume as a relative large part of total volume, depends on the way that a certain bladder volume is attained, via filling or via emptying of the bladder. In other words, slow-filling cystometry and slow-emptying cystometry, even when performed with the same rate of volume change, yield fundamentally different graphs. For clinical evaluation of accommodation of a bladder it is useful to apply both slow-filling cystometry and slow-emptying cystometry.
CONCLUSION
Characteristics of autonomously emptying pig bladder in vitro, analyzed according to a model of an elastic balloon with constant elastic contractility and rest volume, have revealed that the elastic compliance of the bladder CE is not a reproducible constant parameter but show large variation with an increasing trend with bladder volume V. Rest volume VR is a large variable part of total bladder volume and is determined by plasticity and spontaneous contraction activity. The results of slow-emptying experiments on pig bladder in vitro are consisted with the earlier developed concept of accommodation [1]. Active accommodation makes the bladder different to the elastic balloon. The accommodated state of the bladder is characterized by an almost constant combination of elastic volume and rest volume. Tonic pressure marks virtually the border between elastic volume and rest volume. Spontaneous completely transient contraction activities in small regions of bladder wall have a physiological biomechanical function in the process of accommodation. This property is fundamental for the accommodation of low detrusor pressure to large variable total bladder volume. A consequence of this attributed physiological meaning to localized spontaneous activity is that it is not right to fully suppress this activity. However, the amount of spontaneous contraction needs to be kept limited because a growing amount of activity and a not completely transient contraction can cause unstable detrusor pressure. Maintenance of a certain tonic detrusor pressure is understood as an attained equilibrium between small regionally distributed spontaneous completely transient contraction activities and distributed passive elongations (MMs) and is not based on control. VE and VP vary during volume change in a ratio that depends on previous condition of the bladder. There are indications that variation of elasticity of a not stimulated bladder is related to variation of plastic elongated state of contractile tissue. The accompanying change of rest volume VR with V depends on the amount of spontaneous contraction activity. Both elastic and rest volume of a stimulated bladder with open urethra decrease and possibly both to zero.
References
- van Duyl WA, Coolsaet BL. Biomechanics of the urinary bladder: spontaneous contraction activity and micromotions related to accommodation. Int Urol Nephrol. 2021 Jul;53(7):1345–53. https://doi.org/10.1007/s11255-021-02814-w PMID: 33713288
- van Duyl WA; Duyl van WA. A model for both the passive and active properties of urinary bladder tissue related to bladder function. Neurourol Urodyn. 1985;4(4):275–83. https://doi.org/10.1002/nau.1930040404.
- van Mastrigt R, Coolsaet BL, van Duyl WA. Passive properties of the urinary bladder in the collection phase. Med Biol Eng Comput. 1978 Sep;16(5):471–82. https://doi.org/10.1007/BF02457796 PMID: 309982
- I.C.S. The standardization of terminology of low urinary tract function. The International Continence Society Committee on Standardisation of Terminology Sc. J Urol Nephrol (Paris). 1988; Suppl. 114:5–19.
- Wyndaele JJ, Gammie A, Bruschini H, De Wachter S, Fry CH, Jabr RI, et al. Bladder compliance what does it represent: can we measure it, and is it clinically relevant? Neurourol Urodyn. 2011 Jun;30(5):714–22. https://doi.org/10.1002/nau.21129 PMID: 21661019
- Vivian HA. The viscous elastic properties of smooth muscle. Proc R Soc Lond, B. 1926;100(701):108–15. https://doi.org/10.1098/rspb.1926.0036.
- van Duyl WA, Coolsaet BLRA, van Mastrigt R. A new clinical parameter for the assessment of the contractility of the urinary bladder. Urol Int. 1978;33(1-3):31–9. https://doi.org/10.1159/000280173.
- Griffiths D. Detrusor contractility—order out of chaos. Scand J Urol Nephrol Suppl. 2004;38(215):93–100. https://doi.org/10.1080/03008880410015426 PMID: 15545203
- van Mastrigt R, Tauecchio EA. Series-elastic properties of strips of smooth muscle from pig urinary bladder. Med Biol Eng Comput. 1982 Sep;20(5):585–94. https://doi.org/10.1007/BF02443406 PMID: 7176715
- Huxley AF. Muscle structure and theories of contraction. Prog Biophys Biophys Chem. 1957;7:255–318. https://doi.org/10.1016/S0096-4174(18)30128-8 PMID: 13485191
- van Duyl WA. Spontaneous contractions in urinary bladder smooth muscle: preliminary results. Neurourol Urodyn. 1985;4(4):301–7. https://doi.org/10.1002/nau.1930040406.
- Coolsaet BL, van Duyl WA, van Mastrigt R, van der Zwart A. Visco-elastic properties of the bladder wall. Urol Int. 1975;30(1):16–26. https://doi.org/10.1159/000279953 PMID: 1118945
- Trapman JP. Blaas mechanica; trainee report (in Dutch) MMD-group Erasmus University Rotterdam. 1997.
- Eddinger TJ. Reversible plasticity of detrusor smooth muscle: evidence for a key role of “slipping” actomyosin cross-bridges in the control of urinary bladder compliance. Am J Physiol Renal Physiol. 2017 Oct;313(4):F862–3. https://doi.org/10.1152/ajprenal.00227.2017 PMID: 28490527
Supplementary information
Figure S1. Two reservoirs connected by tube 1 which if opened brings water levels in both reservoirs in hydrostatic equilibrium.
Supplementary information of this article can be found online at http://www.bladderj.org/bladder/rt/suppFiles/826.